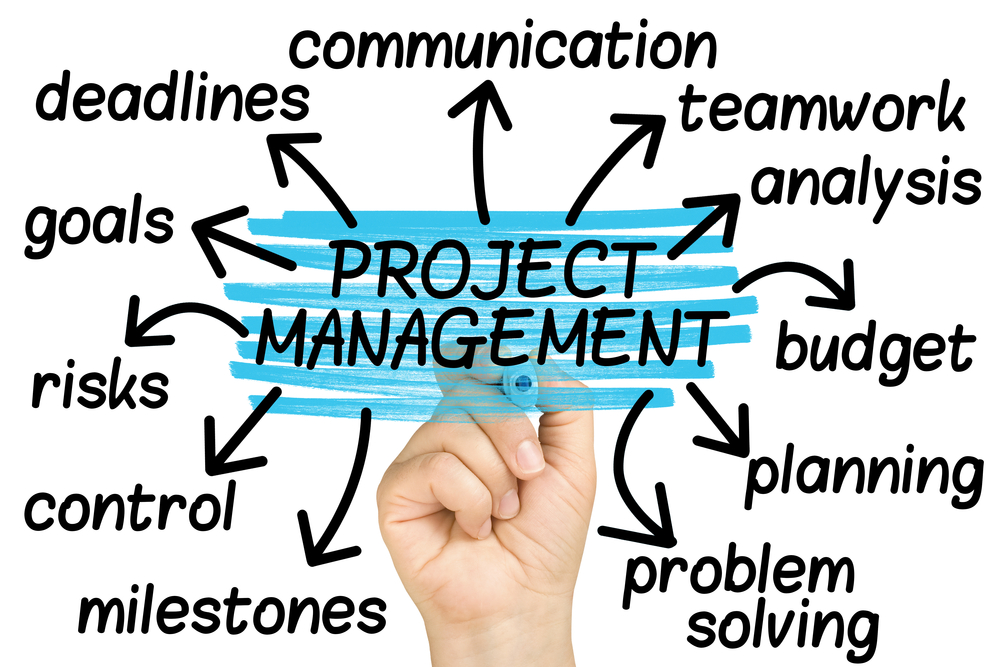
Project planning
A project plan can be described as a road map which shows the route for completing specific objectives and alternative ways from their start to their finish. However, it is usually the case that anyone starting to plan a project is almost always unclear about the important or relevant aspects of such a project. Subsequently, once a project need has been identified and considered feasible then a detailed strategy must be drawn up. This framework or plan is essential for implementing a project by ensuring mat what is needed is accounted for and that the correct steps are taken. The key approach to project planning is to identify and determine the planning parameters of a project.
Planning parameters
Correct planning involves a number of activities which have to be carefully thought out before a project can be implemented. These include:
- Working out the necessary resource requirements,
- Defining each task’s objectives, and
- Determining a set of performance measures to evaluate progress.
The main project parameters that need to be defined beforehand in order to complete these activities involve:
- Quality planning,
- Time planning, and
- Expense planning.
A description of each planning parameter follows.
Planning quality
To plan the quality of a project is to refine the tasks broadly defined during the Project Identification phase. Part of quality planning is to prioritise the order of tasks into a sequence which best fits the project’s progress. It is important to remember that the quality dimension is the crucial linchpin between resources required and the time and cost dimension which is discussed further on. Quality planning outlines the standards of performance expected by project management and provides a useful guide for monitoring project progress. Key quality planning elements are:
- Determining the quality and types of resources needed (human and material),
- Setting the performance standards desired, and
- Verifying output quality.
The latter two elements (performance standards and the verification of output quality) is performed by comparing the actual progress of the project during the Project Implementation phase with the planned progress as defined by the project schedule or the project Strategy Framework (described in the following section).
The former element (determining the quality and types of resources needed) is developed within this Strategy Framework and, more specifically, within a Project Breakdown Structure.
Developing a Strategy Framework
A Strategy Framework breaks a project down into tasks and reduces the possibility of overlooking essential steps or sub-objectives which must be completed during a project cycle. Each task is listed as a specific activity which project management must undertake in order to complete the project.
Tasks can be prioritised according to how essential they are. Categories of essentiality include: essential not so essential, non-essential, and not necessary. This does not mean that tasks which fall within the last category (not necessary) are unnecessary but rather that if budget, time or other unpredictable constraints occur and the Strategy Framework needs to be changed then these tasks can be left out altogether without any lasting disruption to the project.
A Strategy Framework should broadly incorporate the following qualities:
- The goal and sub-objectives of each task,
- General resource commitments, and
- A general layout of planned schedules.
GOAL Build a house TASKS Plan design Prepare resources Construct houses
ACTIVITIES Investigate idea and detail plan Investigate funding, human and material resources
Draw up relevant contracts
Build foundations
Build exterior
Build interior and finish
Table that illustrates a sample Strategy Framework.
A more detailed breakdown of the task schedules and requirements is often necessary when planning quality. This is accomplished by a Project Breakdown Structure.
Developing a Project Breakdown Structure
A Project Breakdown Structure is an analysis of the tasks listed in the Strategy Framework. Each task is broken down into sub-tasks and all the relevant activities identified. Therefore the Project Breakdown Structure goes further than the Strategy Framework by detailing the process required to complete each task of the project. In particular, the Project Breakdown Structure identifies the necessary resources and standards or output quality to be fulfilled.
Useful questions to ask when developing a Project Breakdown Structure include:
- What is the overall goal to be accomplished?
- What has to be done to meet this goal?
- How can it be done?

Planning time
Another critical planning parameter is the time limits set for each task so that the project is finished by a planned completion date. When planning for time, the following considerations must be taken into account:
- The duration or time that should be spent on each step,
- The earliest time when a task should start, and
- The latest time a task should start.
However, it is difficult to finalise a specific time period for each task. Some approaches include reviewing the time periods required for other projects of a similar nature and considering their breakdowns or simply by «guestimating» – guessing and estimating the start and completion dates!
A time scheduler is often applied to estimate these dates.

A practical method for planning time visually is by charts. Two ways to display planned task times or the project schedule are the Gantt Chart and PERT Chart.
The Gantt Chart
The Gantt Chart displays projects where tasks are largely independent of each other. The Gantt Chart shows the tasks in a horizontal bar chart format which is a line representation of the activities which must be completed during a project’s lifespan. A Gantt Chart is created by the following steps:
- Listing the tasks required to complete a project,
- Estimating the time needed for each task,
- Creating a table with the lifespan time of the project displayed (horizontal) and the list of tasks in order of priority (vertical),
- Drawing a line for each task starting at the planned beginning date and ending with the expected completion date, and
- Where task dates can be flexible, then drawing a dotted line to show the leeway for start and end dates.
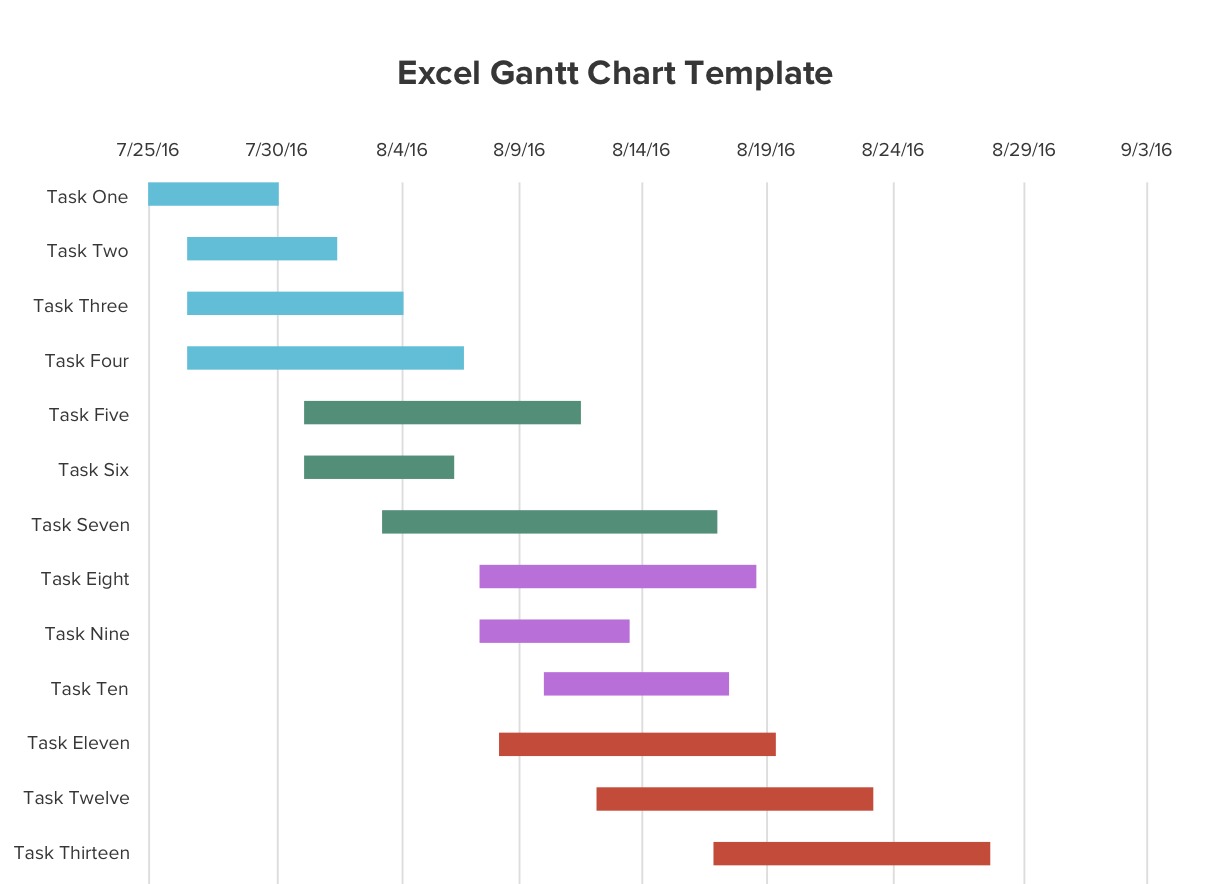
Gantt Charts are useful for simple projects when tasks are not interlinked. More complex and interdependent activities are better displayed by a PERT Chart.
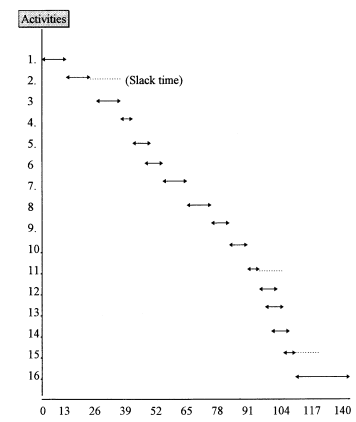
The PERT Chart
The Programme Evaluation and Review Technique or PERT, as it is more commonly known, is useful for projects which involve a number of complex and interdependent tasks. PERT charts are represented by three key features:
- Events or the launch and end dates of each activity,
- Activities or the tasks, and
- Non-activities or interdependent events where no activity is required.
Events and activities are therefore the actions (or tasks) of a project, while non-activities symbolise non-actions and link dependencies between two actions. As with Gantt Charts, the dotted lines represent the slack time or extra time that can be afforded to complete a particular task. A PERT Chart is created by the following steps:
- Listing the steps required to complete a project,
- Estimating the time required for each step,
- Linking the activities by non-activity lines,
- Numbering each task in order of priority,
- Drawing separate paths for steps that are undertaken at the same time, and
- Remembering that the length of the line arrow joining activities indicates the time required
A critical path can be included to show the essential steps required in order of priority. A critical path is calculated by:
- Establishing the sequence of tasks that best fit the time and money constraints, and
- Identifying the tasks most critical for the completion of each stage of the project.
A critical path is useful in the case of limited time or scarce resources.

Planning expense
The costs of resources such as supplies, materials and wages, must be accounted for. Planning costs should not stop once the project is launched but should continue throughout a project’s lifespan in order to keep track of expenses and avoid overspending. However, estimating a project’s costs is not easy as many unexpected costs can be incurred during a project cycle.
To calculate a budget, cost estimates should involve the items listed in the Project Breakdown Structure which typically include labour costs, material costs, travel costs, and administrative costs. An estimate of a project’s costs should consider:
- The knowledge, expertise or skills are required (the greater the expertise, the higher the probable cost), and
- The types and amount of specific materials, supplies and facilities needed.
These costs can be displayed in a budget worksheet. Details of how to prepare a budget are given in Lesson 6.
Table 3F illustrates a budget worksheet.
Delegating responsibilities
Project personnel should hold clearly assigned responsibilities within the project schedule.
If considering the nature of such responsibilities, some useful questions to ask are:
- What kind of knowledge or expertise is required for each task?
- Who best suites the demands of the task?
Once the project has been planned by detailing its quality, costs and time, then the project can be implemented.
CASE STUDY: BUILDING A HOUSE
| GOAL | Build a house |
| TASKS | Plan design
Prepare resources Construct houses |
| ACTIVITIES | Investigate idea and detail plan
Investigate funding, human and material resources Draw up relevant contracts Build foundations Build exterior Build interior and finish |
Table with Sample Strategy Framework
PROJECT DEFINITION: Build a house within three (3) months at a cost of 20,000 before moving in.
The Time Scheduler
A = The amount of time you think is needed to complete the project. The following symbols indicate certain values which need to be calculated by the formula shown below.
B = The least amount of time you think is needed to complete the project
C = The most amount of time you think is needed to complete the project
D = Time schedulers amount of time needed to complete the project
D=(B+C(4*A))/6
In the Time scheduler above you must being with an idea of self-estimation of how long your project can take before its completed. Once you have established a rough figure then the following time spans should be considered: the least possible time and the most possible time your project could take. You then apply the above calculation to get the Time schedulers suggestion of how long your project should take to be completed. Extra time should also be added to the Time schedulers figure to provide insurance against unforeseeable events such as missing materials or a labour strike. Extra time is calculated by the following formula:
Extra time= C- B / 6 x2
The following illustrates how these formulae can be used
Example: The proposed amount of time for a project is 90 days
What amount of time should the project manager plan for?
A = 90 days (amount of time the project manager thinks the project can be completed in).
B = 60 days (the shortest amount of time the project manager thinks the project can be completed in).
C =180 days (the longest amount of time that the project manager thinks the project will take).
D = Answer: The amount of time the Time Scheduler proposes.
Therefore:
| D = | (60 days + 180 days + (4 x 90))/6 |
| D = | (240 days + (360 days))/6 |
| D = | 600 days/6 |
| D = | 100 days (the project should finish after 100 days) |
However, extra time should be added to the proposed schedule (100 days) in case of unexpected events.
Extra time =(180 days – 60 days) / 2 (X2)
Extra time =120 days / 6 (X2)
Extra time =20 days (X2)
Extra time =40 days
Time required for the project = 140 days
Therefore, the final project schedule should be: 100 days + 40 days.
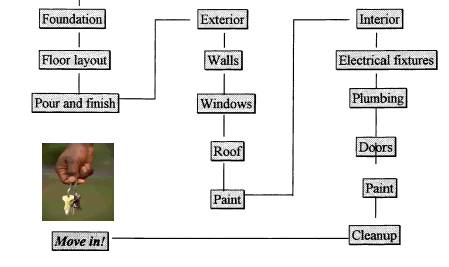
CASE STUDY: BUILDING A HOUSE
Project steps and estimated time
PROJECT DEFINITION: Build a house within 140 days at the cost of 20,000 before moving in.
The time needed for each activity should be added to the list of activities.
- Develop idea (13 days)
- Discuss idea with architect and quantity surveyor (13 days)
- Draw up plan (13 days)
- Obtain funding (4 days)
- Organise builders and materials (8 days)
- Complete contracts and building (9 days)
- Lay foundation (10 days)
- Build walls (10 days)
- Build roof (7 days)
- Install windows (6 days)
- Paint exterior (3 days)
- Install electrical fixtures (5 days)
- Install plumbing (5 days)
- Put in doors (5 days)
- Paint inside (3 days)
- Cleanup and finish (26 days)
The Gantt Chart is displayed below.
CASE STUDY: BUILDING A HOUSE
PROJECT DEFINITION: Build a house within 140 days at the cost of 20,000 before moving in.
Project steps and estimated time
- Start project (- days)
- Plan completed (39 days)
- Funding obtained (4 days)
- Builders and material organised (8 days)
- Contracts and building permit completed (9 days)
- Foundation laid (10 days)
- Walls built (10 days)
- Roof built (7 days)
- Windows installed (6 days)
- Exterior of house painted (3 days)
- Electrical fixtures installed (5 days)
- Plumbing installed (5 days)
- Doors finished (5 days)
- Inside of house painted (3 days)
- Cleanup completed (26 days)
- Project finished (- days)
The PERT Chart is displayed below.
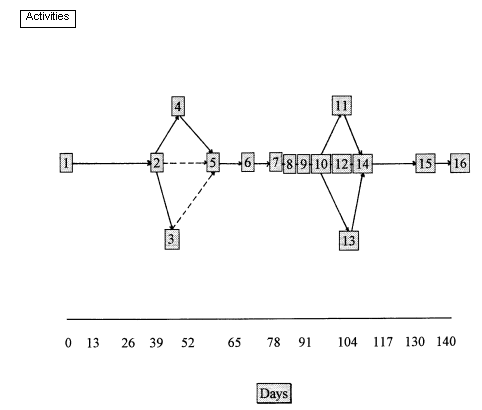
(Please note that Days do not have to be included in such a diagram)
CASE STUDY: BUILDING A HOUSE
PART I
PROJECT DEFINITION: Build a house within 140 days at the cost of 20,000 before moving in. For selected steps refer to the Gantt Chart or PERT Chart .
(Please note that quoted prices are fictional and do not reflect real costs in any way)
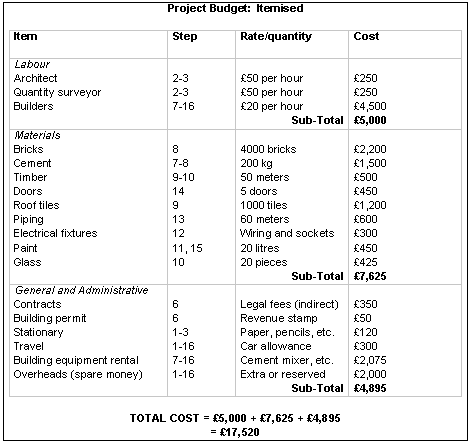
PART II
The Project Budget Schedule calculates the estimated cost of each activity or step in the project plan. Figures are divided over the applicable steps, as itemised under Step. For instance, the final Item Overheads budgets for steps 1-16 for 2,000. This means that in PART II the 2,000 is evenly split over the 16 steps and 125 is added to each step.
Project Budget Schedule
| Activity or Step | Calculation | Total | Cumulative |
| Develop idea | Stationary (40) + Overheads (125) + Travel (18.75) | 183.75 | 183.75 |
| Meet Architect and Quantity Surveyor | Stationary (40) + Overheads (125) + Rate 1 (125) + Rate 2 (125) + Travel (18.75) | 433.75 | 617.50 |
| Draw up plan | Stationary (40) + Overheads (125) + Rate 1 (125) + Rate 2 (125) + Travel (18.75) | 433.75 | 1051.25 |
| Obtain funding | Overheads (125) + Travel (18.75) | 143.75 | 1195.00 |
| Organise builders and materials | Overheads (125) + Travel (18.75) | 143.75 | 1338.75 |
| Complete contracts and building permit | Contracts (350) + Building permit (50) + Overheads (125) + Travel (18.75) | 543.75 | 1882.50 |
| Lay foundation | Builders (450) + Cement (750) + Building equipment rental (207.50) + Overheads (125) + Travel (18.75) | 1551.25 | 3433.75 |
| Build walls | Bricks (2200) + Cement (750) + Builders (45) + Building Equipment rental (207.50) + Overheads (125) + Travel (18.75) | 3732.50 | 7166.25 |
| Build roof | Roof tiles (1200) + Timber (250) + Builders (450) + Travel (18.75) + Building equipment rental (207.50) + Overheads (125) | 2251.25 | 9417.50 |
| Install windows | Glass (425) + Builders (450) + Timber (250) + Travel (18.75) + Building equipment rental (207.50) + Overheads (125 | 1474.25 | 10,891.75 |
| Paint exterior | Pain (225) + Builder (450) + Travel 18.75) + Building equipment rental (207.50) + Overheads (125) | 1026.25 | 11,918.00 |
| Install electrical fixtures | Wiring and sockets (300) + Builders (450) + Travel (18.75) + Building equipment rental (207.50) + Overheads (125) | 1101.25 | 13,019.25 |
| Install plumbing | Piping (600 + Builders (450) + Travel (18.75) + Building equipment rental (207.50) + Overheads (125) | 1401.25 | 14,420.50 |
| Put in doors | 5 doors (450) + Builders (450) + Travel (18.75) + Building Equipment rental (207.50) + Overheads (125) | 1251.25 | 15,671.75 |
| Paint interior | Paint (225) + Builder (450) + Travel (18.75) + Building equipment rental (207.50) + Overheads (125) | 1026.25 | 16,698.00 |
| Cleanup and finish | Builders (450) + Travel (18.75) + Building equipment rental (207.50) + Overheads (125) | 801.25 | 17,499.25 |
Sample Budget Worksheet
Please note that the cumulative total (17,499.25) does not correspond precisely with Part I estimates (17,520) as decimal cents have been rounded off to the nearest cents figure.
(Please note that quoted prices are fictional and do not reflect real costs in any way.)


Publicar comentario